今回は、NumPy と matplotlibライブラリで棒グラフを描いてみます。
シチュエーションとしては、あるテストの国ごとの平均点を棒グラフにしてみたいと思います。で、Excel上に、スコアのデータと国籍のデータが下方向に並んでいるとします。
| USA | 42 |
| Denmark | 42 |
| Japan | 40 |
| Denmark | 38 |
| Italy | 38 |
・
・
棒グラフ
棒グラフを描くには、matplotlib.axes.Axesクラスの bar() を使います。
bar(left, height, width=0.8, bottom=0, **kwargs)

left: それぞれの棒のX座標の位置(配列で指定)
height: それぞれの棒の高さ(配列で指定)
width: 棒の幅
color: 棒の色
yerr: ひげの長さ
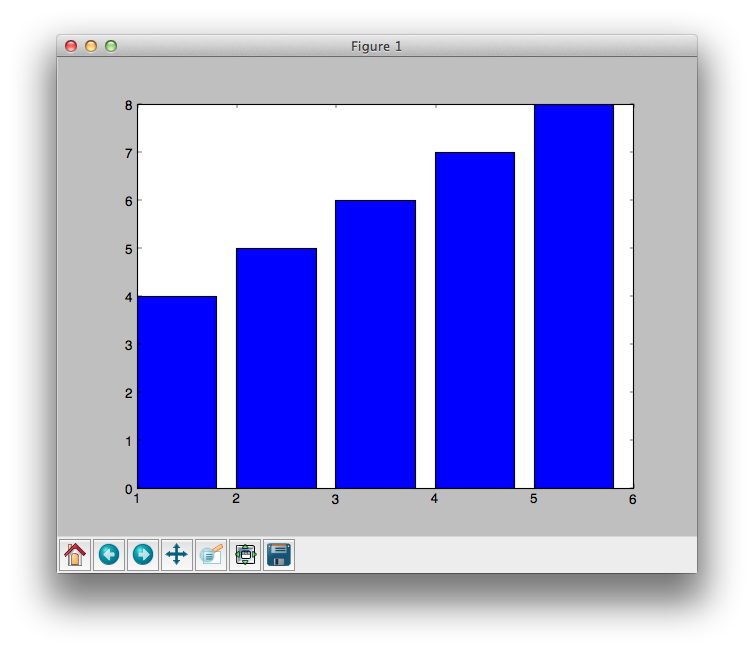
シンプルな棒グラフはこんな感じです。
from matplotlib import pyplot as plt

fig = plt.figure()
ax = fig.add_subplot(111)
ax.bar([1, 2, 3, 4, 5], [4, 5, 6, 7, 8])
plt.show()
こんなグラフが出来上がります。

NumPyで国ごとのデータを集計
以下のように国の配列(nations) とスコアの配列(scores) が numpy.ndarray型で取得できたとします。
>>> nations
array([u'USA', u'Denmark', u'Japan', u'Denmark', u'Italy', u'Russia',
       u'Turkey', u'Denmark', u'Greece', u'Japan', u'?', u'Germany',
       u'Japan', u'Turkey', u'UK', u'Japan', u'Denmark', u'Turkey', u'UK',
       u'Germany', u'?', u'Turkey', u'Norway', u'USA/Singapore', u'Sweden',
       u'Denmark', u'Japan', u'Hong Kong', u'Finland', u'Japan', u'Italy',
       u'Denmark', u'Belgium', u'Norway', u'Japan', u'Denmark', u'Norway',
       u'Turkey', u'Czech', u'Germany', u'Japan', u'Japan', u'Haiti',
       u'Japan', u'Denmark', u'UK', u'Germany', u'Turkey', u'Denmark',
       u'Japan', u'Germany', u'Japan', u'Czech', u'UK', u'Sweden',
       u'Switzerland', u'Turkey', u'Japan', u'UK', u'Japan', u'Sweden',
       u'Japan', u'Denmark', u'UK', u'Japan', u'Switzerland', u'Turkey',
       u'Norway', u'Sweden', u'Germany', u'France', u'Japan', u'UK',
       u'Japan', u'Japan', u'Switzerland', u'Czech', u'Japan', u'Japan',
       u'Denmark', u'Japan', u'Japan', u'Sweden', u'Denmark', u'Norway',
       u'Israel', u'Japan', u'Japan', u'Turkey', u'Turkey', u'Turkey',
       u'Turkey', u'Lebanon', u'Turkey', u'Japan', u'Turkey', u'Japan',
       u'Japan', u'Japan', u'Japan', u'Japan', u'Turkey', u'Spain',
       u'Belgium', u'Belgium'],
      dtype='
>>> scores
array([42, 42, 40, 38, 38, 38, 38, 35, 35, 35, 35, 34, 34, 34, 34, 33, 33,
       33, 33, 32, 32, 32, 30, 30, 30, 30, 30, 30, 30, 30, 29, 29, 29, 28,
       28, 28, 28, 28, 27, 27, 27, 27, 27, 27, 26, 26, 26, 26, 26, 26, 25,
       24, 24, 24, 24, 23, 23, 23, 23, 23, 23, 23, 23, 23, 22, 22, 22, 22,
       22, 22, 22, 22, 21, 21, 20, 20, 20, 20, 20, 19, 19, 19, 19, 19, 18,
       18, 17, 17, 16, 16, 16, 16, 15, 15, 15, 15, 14, 13, 13, 13, 13, 12,
       12, 11,  9])
ここから、国名が 'Japan' のスコアを取り出すには、numpy.where を使います。
条件に合致する nations のインデックスを返してくれるので、scores[numpy.where(nations == 'Japan')] とすることで、スコアの配列が得られます。
>>> numpy.where(nations == 'Japan')
(array([  2,   9,  12,  15,  26,  29,  34,  40,  41,  43,  49,  51,  57,
        59,  61,  64,  71,  73,  74,  77,  78,  80,  81,  86,  87,  94,
        96,  97,  98,  99, 100]),)

>>> scores[numpy.where(nations == 'Japan')]
array([40, 35, 34, 33, 30, 30, 28, 27, 27, 27, 26, 24, 23, 23, 23, 22, 22,
       21, 20, 20, 20, 19, 19, 17, 17, 15, 14, 13, 13, 13, 13])
しかしもっと単純に、numpy.whereの代わりに nations == 'Japan' を使っても同じ結果を求めることができます。
>>> nations == 'Japan'
array([False, False,  True, False, False, False, False, False, False,
        True, False, False,  True, False, False,  True, False, False,
       False, False, False, False, False, False, False, False,  True,
       False, False,  True, False, False, False, False,  True, False,
       False, False, False, False,  True,  True, False,  True, False,
       False, False, False, False,  True, False,  True, False, False,
       False, False, False,  True, False,  True, False,  True, False,
       False,  True, False, False, False, False, False, False,  True,
       False,  True,  True, False, False,  True,  True, False,  True,
        True, False, False, False, False,  True,  True, False, False,
       False, False, False, False,  True, False,  True,  True,  True,
        True,  True, False, False, False, False], dtype=bool)

>>> scores[nations == 'Japan']
array([40, 35, 34, 33, 30, 30, 28, 27, 27, 27, 26, 24, 23, 23, 23, 22, 22,
       21, 20, 20, 20, 19, 19, 17, 17, 15, 14, 13, 13, 13, 13])
こうなったら、もう何でもできますね。
>>> scores[nations == 'Japan'].size
31
>>> scores[nations == 'Japan'].sum()
708
>>> scores[nations == 'Japan'].mean()
22.838709677419356
>>> scores[nations == 'Japan'].std()
6.9935305320567211
サンプル
以上を踏まえたサンプルがこちら。
test_bar_chart.py
#! /usr/bin/env python
# -*- coding: utf-8 -*-

import collections
import numpy
import xlrd
from matplotlib import pyplot as plt


def get_data(sheet, rowx, colx):
    data = []
    for row in range(rowx, sheet.nrows):
        value = sheet.cell(row, colx).value
        if value != '':
            data.append(value)
    data = numpy.array(data)
    return data


if __name__ == '__main__':
    book = xlrd.open_workbook('/Users/akiyoko/Documents/temp/2nd_test.xls')
    sheet = book.sheet_by_name('Statistics (total score)')
    scores = get_data(sheet, 9, 5)  # データの起点はF10
    nations = get_data(sheet, 9, 3)  # データの起点はD10
    print 'scores=%s' % scores
    print 'nations=%s' % nations
    total_size = scores.size
    print 'N=%d' % total_size

    # ラベル
    # labels = list(set(nations)) でもよかったが、
    # 並び順がランダムなのもどうかと思ったので、度数の大きい順に並べ替えてみる
    counter = collections.Counter(nations)
    ranked_data = counter.most_common()
    labels = [x[0] for x in ranked_data]
    print 'labels=%s' % labels

    # 共通初期設定
    plt.rc('font', **{'family': 'serif'})
    # キャンバス
    fig = plt.figure()
    # ラベルが隠れてしまうのを補正
    fig.subplots_adjust(bottom=0.22)
    # プロット領域(1x1分割の1番目に領域を配置せよという意味)
    ax = fig.add_subplot(111)
    # 棒グラフ
    ind = numpy.arange(len(labels))
    print 'ind=%s' % ind
    bar_width = 0.8
    mus = []
    sigmas = []
    for label in labels:
        print 'nation=%s' % label
        # 国ごとのスコア
        scores_by_nation = scores[nations == label]
        print 'scores_by_nation=%s' % scores_by_nation
        # 平均
        mu = numpy.mean(scores_by_nation)
        mus.append(mu)
        print 'mean value=%.1f' % mu
        # 標準偏差
        sigma = numpy.std(scores_by_nation)
        sigmas.append(sigma)
        print 'standard deviation=%.2f' % sigma
    b = ax.bar(ind, mus, bar_width, yerr=sigmas)
    # ラベル
    ax.set_xticks(ind)  # ax.set_xticks(ind + bar_width / 2)
    ax.set_xticklabels(labels, rotation=75)
    # タイトル
    ax.set_title('Scores by Nation: N=%s' % total_size, size=16)
    plt.show()
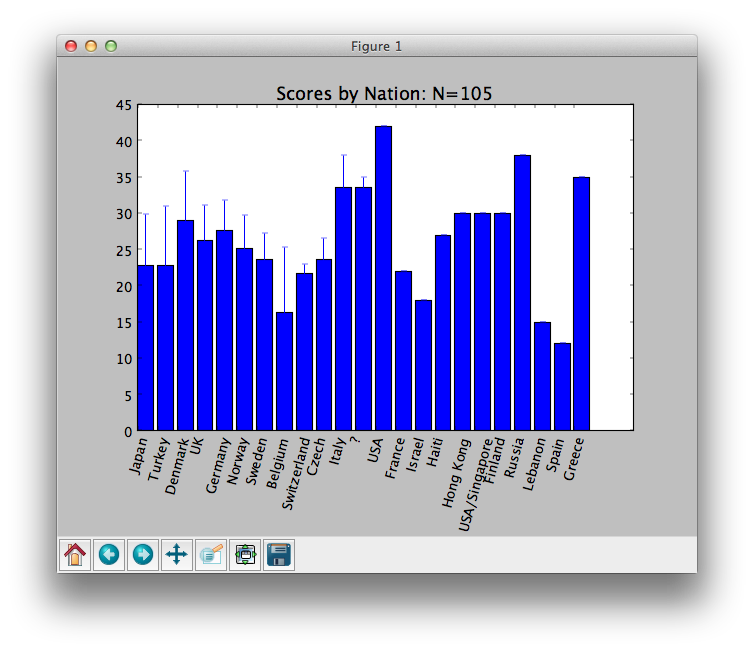
実行結果
$ python test_bar_chart.py
scores=[ 42.  42.  40.  38.  38.  38.  38.  35.  35.  35.  35.  34.  34.  34.  34.
  33.  33.  33.  33.  32.  32.  32.  30.  30.  30.  30.  30.  30.  30.  30.
  29.  29.  29.  28.  28.  28.  28.  28.  27.  27.  27.  27.  27.  27.  26.
  26.  26.  26.  26.  26.  25.  24.  24.  24.  24.  23.  23.  23.  23.  23.
  23.  23.  23.  23.  22.  22.  22.  22.  22.  22.  22.  22.  21.  21.  20.
  20.  20.  20.  20.  19.  19.  19.  19.  19.  18.  18.  17.  17.  16.  16.
  16.  16.  15.  15.  15.  15.  14.  13.  13.  13.  13.  12.  12.  11.   9.]
nations=[u'USA' u'Denmark' u'Japan' u'Denmark' u'Italy' u'Russia' u'Turkey'
 u'Denmark' u'Greece' u'Japan' u'?' u'Germany' u'Japan' u'Turkey' u'UK'
 u'Japan' u'Denmark' u'Turkey' u'UK' u'Germany' u'?' u'Turkey' u'Norway'
 u'USA/Singapore' u'Sweden' u'Denmark' u'Japan' u'Hong Kong' u'Finland'
 u'Japan' u'Italy' u'Denmark' u'Belgium' u'Norway' u'Japan' u'Denmark'
 u'Norway' u'Turkey' u'Czech' u'Germany' u'Japan' u'Japan' u'Haiti'
 u'Japan' u'Denmark' u'UK' u'Germany' u'Turkey' u'Denmark' u'Japan'
 u'Germany' u'Japan' u'Czech' u'UK' u'Sweden' u'Switzerland' u'Turkey'
 u'Japan' u'UK' u'Japan' u'Sweden' u'Japan' u'Denmark' u'UK' u'Japan'
 u'Switzerland' u'Turkey' u'Norway' u'Sweden' u'Germany' u'France' u'Japan'
 u'UK' u'Japan' u'Japan' u'Switzerland' u'Czech' u'Japan' u'Japan'
 u'Denmark' u'Japan' u'Japan' u'Sweden' u'Denmark' u'Norway' u'Israel'
 u'Japan' u'Japan' u'Turkey' u'Turkey' u'Turkey' u'Turkey' u'Lebanon'
 u'Turkey' u'Japan' u'Turkey' u'Japan' u'Japan' u'Japan' u'Japan' u'Japan'
 u'Turkey' u'Spain' u'Belgium' u'Belgium']
N=105
labels=[u'Japan', u'Turkey', u'Denmark', u'UK', u'Germany', u'Norway', u'Sweden', u'Belgium', u'Switzerland', u'Czech', u'Italy', u'?', u'USA', u'France', u'Israel', u'Haiti', u'Hong Kong', u'USA/Singapore', u'Finland', u'Russia', u'Lebanon', u'Spain', u'Greece']
ind=[ 0  1  2  3  4  5  6  7  8  9 10 11 12 13 14 15 16 17 18 19 20 21 22]
nation=Japan
scores_by_nation=[ 40.  35.  34.  33.  30.  30.  28.  27.  27.  27.  26.  24.  23.  23.  23.
  22.  22.  21.  20.  20.  20.  19.  19.  17.  17.  15.  14.  13.  13.  13.
  13.]
mean value=22.8
standard deviation=6.99
nation=Turkey
scores_by_nation=[ 38.  34.  33.  32.  28.  26.  23.  22.  16.  16.  16.  16.  15.  15.  12.]
mean value=22.8
standard deviation=8.19
nation=Denmark
scores_by_nation=[ 42.  38.  35.  33.  30.  29.  28.  26.  26.  23.  19.  19.]
mean value=29.0
standard deviation=6.82
nation=UK
scores_by_nation=[ 34.  33.  26.  24.  23.  23.  21.]
mean value=26.3
standard deviation=4.77
nation=Germany
scores_by_nation=[ 34.  32.  27.  26.  25.  22.]
mean value=27.7
standard deviation=4.11
nation=Norway
scores_by_nation=[ 30.  28.  28.  22.  18.]
mean value=25.2
standard deviation=4.49
nation=Sweden
scores_by_nation=[ 30.  24.  23.  22.  19.]
mean value=23.6
standard deviation=3.61
nation=Belgium
scores_by_nation=[ 29.  11.   9.]
mean value=16.3
standard deviation=8.99
nation=Switzerland
scores_by_nation=[ 23.  22.  20.]
mean value=21.7
standard deviation=1.25
nation=Czech
scores_by_nation=[ 27.  24.  20.]
mean value=23.7
standard deviation=2.87
nation=Italy
scores_by_nation=[ 38.  29.]
mean value=33.5
standard deviation=4.50
nation=?
scores_by_nation=[ 35.  32.]
mean value=33.5
standard deviation=1.50
nation=USA
scores_by_nation=[ 42.]
mean value=42.0
standard deviation=0.00
nation=France
scores_by_nation=[ 22.]
mean value=22.0
standard deviation=0.00
nation=Israel
scores_by_nation=[ 18.]
mean value=18.0
standard deviation=0.00
nation=Haiti
scores_by_nation=[ 27.]
mean value=27.0
standard deviation=0.00
nation=Hong Kong
scores_by_nation=[ 30.]
mean value=30.0
standard deviation=0.00
nation=USA/Singapore
scores_by_nation=[ 30.]
mean value=30.0
standard deviation=0.00
nation=Finland
scores_by_nation=[ 30.]
mean value=30.0
standard deviation=0.00
nation=Russia
scores_by_nation=[ 38.]
mean value=38.0
standard deviation=0.00
nation=Lebanon
scores_by_nation=[ 15.]
mean value=15.0
standard deviation=0.00
nation=Spain
scores_by_nation=[ 12.]
mean value=12.0
standard deviation=0.00
nation=Greece
scores_by_nation=[ 35.]
mean value=35.0
standard deviation=0.00

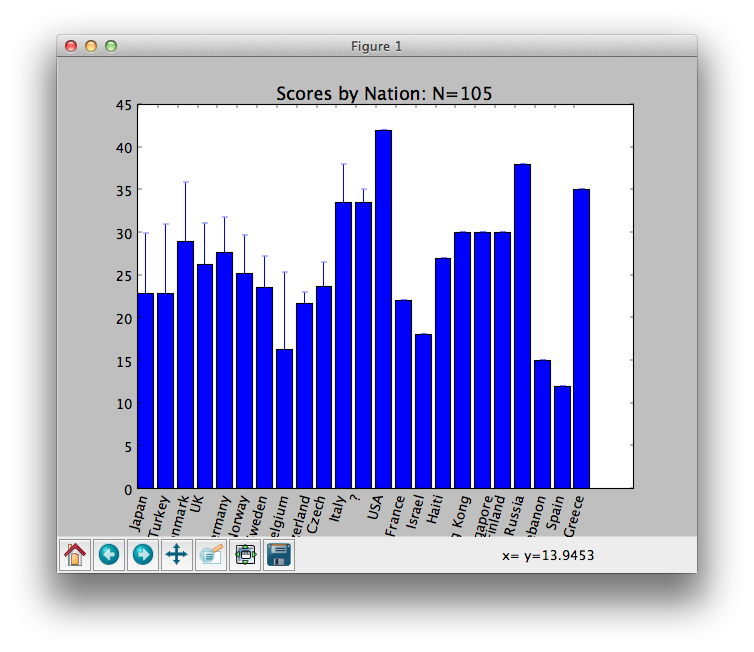
ラベルが少し隠れているのが残念ですね。今後、改良していきます。
ラベルが隠れるのを修正できました。
# ラベルが隠れてしまうのを補正
fig.subplots_adjust(bottom=0.22)
とやればよいのでした。bettamodokiのメモ が参考になりました。(2013/6/25追記)
ちなみに、修正前のグラフはこちら。
